Introduction
A few people have asked to read my dissertation which reviewed the financial outcome of partnerships in the cybersecurity market. I’ve published a reduced version here for those that want to read it, and I will summarise the key points.
It’s important to note that a limitation of this research is that only secondary research was permitted. No companies were interviewed, which may result in some inaccuracies and a lack of wider context that would have come from primary research. For this reason, I’m not going to release the complete data set as I don’t wish to risk identifying any of the companies included.
The risk of inaccurate, incomplete, or out-of-date data is a key issue with some of the findings. While every step was taken to mitigate that, it’s an inherent risk. There is also a risk that my interpretations for the “why” behind the outcomes is wrong.
What was clear to me, spending around 9 months studying this area, is that I have more questions that answers. That in itself was a great learning point and will inform how I make decisions and what I consider myself an expert at in the future!
Executive Summary
A thorough literature review of partnerships as a sales strategy revealed very little recent research, and almost nothing on cybersecurity partnerships. Some key themes did emerge, which concur with the general view I’ve seen of partnerships in the industry. The prevailing view is that partnerships are the best sales strategy and yet there seems to be little research done to analyse their effectiveness and challenge that view.
The literature review found:
The key findings from the data analysis revealed:
Some interesting themes around different countries emerged.
If you want to read a selection of the final dissertation, please read on!
Planning Stage
A list of 180 companies was compiled from Stiennon (2019) as this compilation is self-funded and the least biased source that could be found. A large number of companies were included in the list to ensure that an adequate data set could be obtained if certain data points were not discoverable.
The following data was collected, to align with the questions and research objectives. This is summarised in the table below.
| Research Questions | Data Compiled and Analysis | Source |
| What partnerships are publicised by cybersecurity SAAS companies? | Number of partnerships | Company website – partner pages |
| Can partner organisations be subdivided into categories? If yes, what is the most commonly used category? | Types of partnerships | Company website – partner pages |
| What value is publicly attributed to partnerships? | Financial data relating to partnerships | Company website – blog and press pages Company accounts Press announcements/industry articles |
| How many direct sales employees do the companies have? | Employee numbers in sales, channel, and total | |
| What level of funding and/or revenue has been announced by cybersecurity companies? | Funding, revenue, and company valuation | Pitchbook |
| Is there a link between the number of partnerships, type of partnerships, or the number of employees and funding and/or revenue? | Number of partnerships to revenue Number of partnerships to company valuation Number of sales staff to revenue Number of sales staff to company valuation Number of channel staff to number of partnerships Number of sales staff to number of partnerships | Pearson Correlation |
| Is this the main determining factor for success or is another factor more relevant, such as the quality of the product? | Analysis of correlations Analysis of qualitative data |
Analysis
The following relationships were analysed.
- Number of partnerships to revenue
- Number of partnerships to company valuation
- Number of sales staff to revenue
- Number of sales staff to company valuation
- Number of channel staff to number of partnerships
- Number of sales staff to number of partnerships
An outcome of 0.5 or -0.5 is considered necessary for a strong correlation (Rumsev, 2011). In addition, the author looked for at least 2 countries to be contributing to the overall correlation to consider it strong and to mitigate the inclusion of the Israeli data.
| Data Point | Total | UK | Israel | US | Correlation Strength |
| Partnerships to Revenue | 0.004967287 | 0.095677 | -0.04681 | 0.191947 | Weak correlation |
| Partnerships to Valuation | 0.516659431 | 0.119819 | 0.96226 | 0.185487 | Some correlation |
| Sales staff to Revenue | 0.060681924 | 0.621737 | 0.014486 | 0.709328 | Weak correlation |
| Sales staff to valuation | 0.724906193 | 0.356519 | 0.954541 | 0.826776 | Strong |
| Channel staff to Partnerships | 0.501630952 | -0.04351 | 0.966336 | 0.115432 | Some correlation |
| Sales staff to Partnerships | 0.376392825 | -0.0063 | 0.928839 | 0.085228 | Some correlation |
Pearson Correlation Results for Data Analysis
Correlation with revenue
The correlation to revenue is the most interesting. Overall, there is a weak correlation between partnerships and revenue. For Israeli companies that correlation is negative, although there is not enough data for this to be conclusive. A weak correlation indicates that increasing the number of partnerships does not increase revenue. The correlation between sales staff and revenue overall is also weak. However, when considering the UK and US only, this correlation becomes much stronger. This finding is in direct contradiction to the conclusion of the literature review. This data appears to support a decision to invest in a direct sales team over partnerships as a way of increasing revenue.
The qualitative data appears to support partnerships. Company X attributes its growth to partnerships. Company Y announced a move from a direct strategy to a partnership one, to accelerate its growth. None of the press data gathered attributed financial value or expected value to a partnership arrangement. Some of this data was found in company accounts. Company Z attributes 46% of sales to partnerships and intends to increase this percentage. However, their direct sales team is still contributing more revenue. Company A invested in key partnerships, however, they also doubled the size of their internal team to deliver growth. It appears that the industry believes in the value of partnerships, aligning with the existing literature. However, there is little analysis being done to prove their actual value.
Correlation with valuation
There is a stronger correlation between both partnerships and sales staff, to a company valuation. As company valuations are typically tied to revenue, this result is somewhat surprising. This difference is most notable for Israeli companies. This would suggest that investors value partnerships as an indicator of success, or potential.
The data also becomes interesting for a company expanding to the US. The US has a lower correlation between partnerships and company valuation but a much higher correlation between sales team size and company valuation. Important to note is that the US is the largest cybersecurity market (European Commission, 2019). The majority of VC investors are also based in the US (Ingalls, 2022). This may suggest that investors value companies with a strategy to sell in the US highly, which is why direct teams are valued for US companies, and a partner strategy is valued for overseas companies. This is also consistent with the literature review, which found a partnership strategy for exporting companies to be more successful (Anderson & Coughlan, 1987). However, this would require further investigation.
This is also interesting for Israeli companies, direct sales teams have a much higher correlation to revenue than partnerships but a similar correlation for valuation. A suggestion would be that investors are looking for companies with an export strategy but this requires further investigation.
Staff numbers
There was some correlation between the number of sales staff and channel staff compared to the number of partnerships. This is not surprising for the sales staff correlation, as their focus may not be building new partnerships although they may discover partnership opportunities in their normal sales activities. It is also possible that channel staff are employed to maintain relationships with the channel, rather than increase the number of partnerships. This would align with the report from Kalvanam & Brar (2009) about the investment required to ensure the success of partnerships. However, a stronger correlation was expected. As directly employed staff are more costly, this is an important factor to consider for the ROI of the investment decision.
The correlation was strongest for Israeli companies, weak for US companies, and negative for UK companies. As seen in Table 11, Israel employs a higher percentage of staff in sales and partnerships. As they had collectively raised more funding than UK companies ($3.8 billion compared to $2 billion) this may demonstrate the impact of their investors. With a negative correlation for UK companies and a very weak correlation for US companies, it appears that companies in these countries are pursuing a direct strategy above a partnership one. The UK had the lowest number of partnerships overall, strengthening this assessment. However, the UK has the lowest revenues and the lowest valuation of their companies. This may imply that UK companies are not pursuing the best strategy for growth.
Also noted in the data was that companies in all countries employed around 30% of their total staff in sales which may be interesting to companies considering their GTM strategy.
| Total | UK | Israel | US | |
| Number of partnerships | 13083 | 943 | 3446 | 8681 |
| % of staff employed in sales | 31 | 30 | 33 | 30 |
| % of staff employed in channel | 7 | 6 | 10 | 7 |
| Total funding received $ | 14135870000 | 2186480003 | 3889040000 | 8060350000 |
| Total revenue $ | 50466423758 | 1236458000 | 28850570000 | 9251273758 |
| Total company valuation $ | 160301260000 | 22094680000 | 347363500000 | 103470080000 |
Summary of data collected
Types of partnerships
The types of partnerships entered into were also reviewed and are shown in Table 12. It was notable that technology firms were the largest group, overall followed by VARs. However, UK companies had more relationships with VARs than technology companies. Other cybersecurity companies also made up a large number of these relationships, perhaps indicative of the desire within the industry to create partnerships, as suggested in the literature review. This would benefit from further research.
| Type | Total | UK | Israel | US |
| Technology | 71 | 14 | 35 | 22 |
| VAR | 58 | 20 | 21 | 17 |
| Cybersecurity | 21 | 7 | 11 | 3 |
| Consulting | 8 | 3 | 5 | 0 |
| MSP | 16 | 3 | 7 | 6 |
Types of partnership
It was noted in the qualitative analysis that there was a trend to announce a partnership with large customers. This suggests a trend to treat customers as partners, perhaps with some customisation. This trend would require further analysis to determine the reason for the wording of such announcements.
There is a clear preference within the industry to partner with certain organisation types. This was also missing from the literature review. However, as there is no clear correlation between partnership numbers and revenue, further research into which of these are revenue-generating is warranted.
Other factors
This data may also call into question the literature that suggests GTM strategy is more important than other factors, such as the quality of the product which was enforced by Altschuler (2016). Given the limited correlation between GTM data and revenue, it is possible that in the cybersecurity market, the quality of the product plays a more significant factor. The buyers of cybersecurity products are typically industry experts themselves and may be more discerning buyers. It may also be an indicator of the competitive nature of the industry. Not explored in this research was marketing budgets and the marketing strategy may have an impact on company success. These questions require further research.
Additional Analysis
To provide further insight it was decided to see if there was an optimum number of partnerships or sales staff in relation to revenue. The literature suggested that partnerships can require significant management, and that just a few partnerships generate the majority of the revenue. The decision was made to compare partnerships and sales staff, to revenue on an individual basis.
Analysis
The results of this analysis are shown in Graphs 1 and 2. Neither graph produced the expected result. While Graph 1, comparing partnerships to revenue does produce the expected line, this is because of two outlier companies and the majority of companies do not form any type of trend. The same is true of Graph 2, comparing sales staff to revenue. Both graphs include one outlier company with high revenue, high partnerships, and a high number of sales staff. Rather than suggesting an optimum, there is significant volatility in the remainder of the graph, providing no clear result.
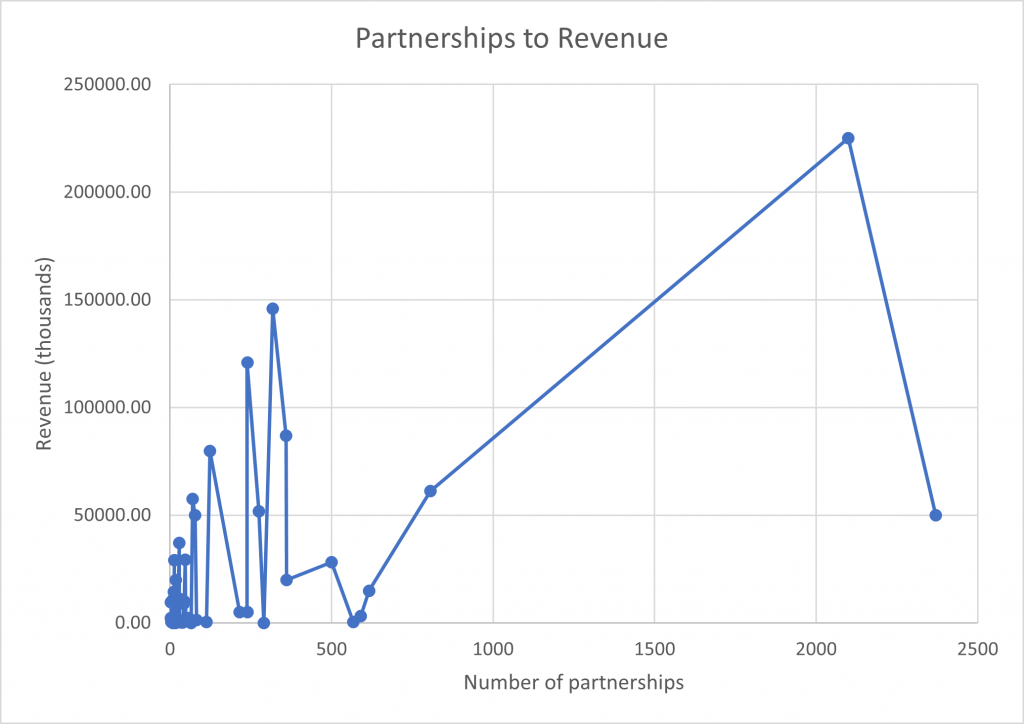
Graph 1 – Scatter graph comparing partnerships to revenue
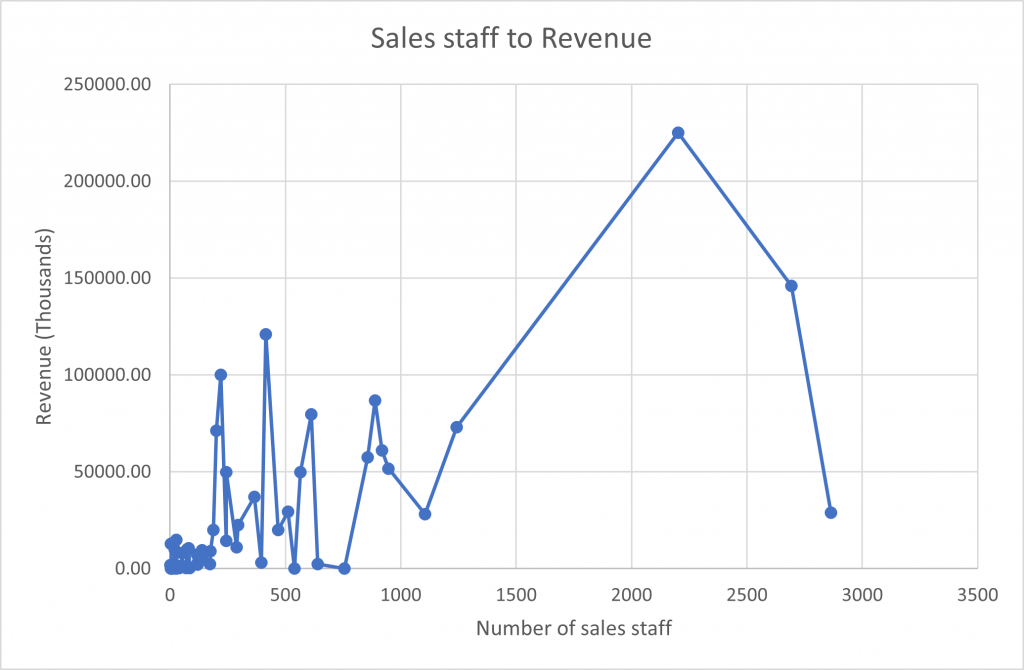
Graph 2 – Scatter graph comparing sales staff to revenue
The results require further analysis to determine a cause. Some sales teams may be more effective than others and able to deliver better results, as supported by Wollan et al (2013). The organisational charts of these teams are also not considered. Potentially, small teams delivering higher revenue have outsourced functions such as lead generation. If larger teams have insourced these functions their teams may appear less effective but do not represent a fair comparison. What marketing technology is utilised is not considered and as demonstrated by Brinker (2020), this could be extensive. Some companies may manage their partnerships more effectively. Some partnerships may be at different stages of inception and may not yet be generating revenue. These questions could be supported with larger data sets or primary research.
One hypothesis supported by the lack of a trend in the data is that GTM strategy is not the best predictor of success. Further research into other factors in the value proposition is required for the cybersecurity market.
Conclusion
The first objective was to establish an understanding of which routes to market are prevalent in the cybersecurity SAAS industry. The data collected established that both direct sales teams and partner strategies are prevalent, with 5 types of partnerships being common. The composition of teams is now better understood and there is a greater understanding of differences between companies in different geographies.
A crucial objective was to establish a link between the route to market and financial success. While some correlation was present, there was no clear optimum GTM strategy. This enables further research or investment into other strategies and product quality. The real purpose of this objective was to establish if the ROI is greater from a direct route or a channel sales route. There is an indicator of success for direct sales teams. However, without more data on the cost of these strategies, it is hard to establish full ROI.
One limitation of the study was the lack of primary data. If this had been included, the financial data may have been more complete, and more reliable. There would also have been an opportunity to assess the why behind some of the strategies other companies are implementing. However, this would also have included some bias, with companies potentially looking to justify or embellish the success of their chosen strategy. As the purpose was to question commonly held assumptions, the impersonal nature of the data collection can also be seen as a strength. Collecting data on additional companies, or more data points may have enhanced the findings. However, time did not allow for additional data to be collected.